
Software Design and Implementation
T7: Debugging
Paired assignment T7 should be completed with a partner.
One of the most common frustrations with programming is finding bugs and fixing your code. Debugging is the process of identifying and eliminating unexpected behavior produced by your code. The IDE understands your frustrations, and has tools to help make debugging code easier for you. Let's first explore some code, then look at some of these tools.
Here are a few of the most important tools you'll need to understand to become a master debugger. First, you will need to set the debug mode of the IDE as follows:
Spyder Debug Controls |
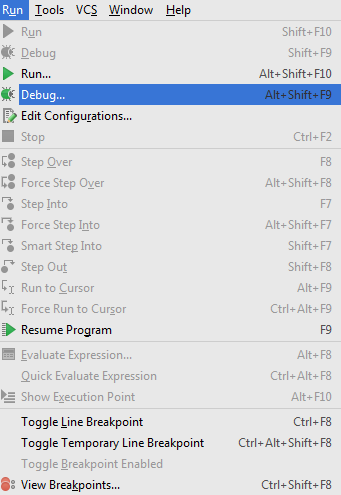
PyCharm Debug Controls |
 Figure 1Ss: Spyder Debug Shortcut Menuor
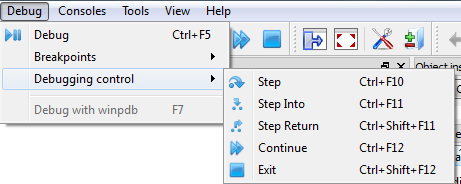 Figure 1Sm: Spyder Debug MenuThe Spyder Debug button: The very first control in both the debug menu and shortcut debug menu turns on the Debug mode  You can also use Contol-F5, which will run your code in
debug mode rather than simply running your program directly.
You can also use Contol-F5, which will run your code in
debug mode rather than simply running your program directly. |
|
Breakpoints: Debug mode will make it so that it will stop at your breakpoints. Clicking on the button again after reaching a breakpoint will resume running your program until it ends or another breakpoint is reached. Breakpoints are lines in your program that you have indicated where the IDE should stop running the code so that you can see a "snapshot" of what the variable values are on that line. Figure 2 below shows an example of setting a breakpoint INSIDE a function, which is very useful.
In most IDEs you can set a breatkpoint, highlight the line where you want to set the breakpoint and click in the margin. A red dot will appear as shown in Figure 2 below. Note that busing nreakpoints before returns (as shown) is generally a good idea.

Figure 2S: A breakpoint in Spyder

Figure 2P: A breakpoint in PyCharm
The debugger console: Most debuggers gives you a list of all the variables that are defined and have value in the program. Of course the IDE cannot display a variable UNTIL it is actually used. Also take note that your normal console (where syntax error messages typically appear) may now be hidden behind the debugger tab.
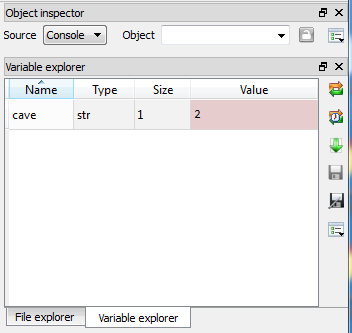
Figure 3S: The Variable Explorer in Spyder in debug mode

Figure 3Pa: The debugger console in PyCharm during
debug mode

Figure 3Pb: The Watches tab in PyCharm's debugger console
Stepping, Stepping Into, Stepping Over: Causes the IDE to "enter" into a function that is called at that line. You will jump to the point that the function starts, and you can run one step at a time of the called function. This is called stepping, The middle controls in Spder give you controls to: run current line, sttepping into a function, and stepping out of the function (running until the return.) See figure 4S. Figure 4S: The Step Into button in Spyder's debugger console
Figure 4P shows how to step into a function in PyCharm.

Figure 4P: The Step Into button in PyCharm's debugger console
Step return or Step out: Step out will tell the IDE interpreter to execute the rest of the lines in a function and pause after the function call is over. Figure 4 above also shows the step out button, one or two buttons to the right of the step in button in each IDE.
The Resume Program button: This button exits debug mode and enables regular runs of your program once you are done debugging (see Figure 5).
 |
Figure 5P: The Resume Program button in PyCharm's debugger console |

Your Team Assignment
Here are some buggy Python code samples which you and your partner will fix in this assignment:- debug-birthday.py (right-click to download)
- debug-circle.py (right-click to download)
- debug-unittest-change.py # Use the version of unittest-change.py with the test suite created in T4 if possible
All partners should also create a Microsoft Word file called yourusername(s)-t7.docx
where yourusername(s) is appropriately replaced.
The instructions
This Paired Assignment has several steps:- Remember that the primary objective is to learn to use the
debugger effectively, so please do not think that the objective is
to just fix the errors--fixing the errors is just a vehicle to
using the debugger.
- Create a new folder called yourusernames-t7 into which you will return repaired programs:
- Download the buggy python code samples which you and your
partner will fix in this assignment:
- debug-birthday.py and rename yourusernames-birthday.py
- debug-circle.py and rename yourusernames-circle.py
- debug-unittest-change.py from T4 and rename yourusernames-change.py
- In the header of each of these programs, put both partners names as having modified the code. Also, include the role each partner played. e.g. navigator, driver, etc.
- For each of these programs, look carefully at the syntax and flow of control. Each of these programs has multiple problems which you should repair. These are marked with the IDE keyword FIXME.
- The debugger is generally useful for looking at the values of variables without having to add print lines, and also to identify at what point a program crashes. Be sure to use each of the following debugger techniques:
- Setting a breakpoint in a function to look at the values of the variables which are local to the function.
- Running the code to the breakpoint in debugger mode.
- Stepping through code line by line while watching the variables.
- Be sure to add comments to the code describing each of the things you fixed and why you needed to fix them.
- In the report, put the assignment name and partners names and roles on top. Then answer the following questions:
- Which feature of the debugger did you find the most useful for this assignment? For what error did you find it useful?
- What kind of bugs do you think using a breakpoint would be useful for?
- What kind of bugs do you think stepping through code line-by-line would be useful for?
- How much do you foresee you and your partner using the debugger in future assignments? Explain.
- When complete, one partner should put the repaired programs in the folder, zip the folder, and upload into Moodle.
- Remember that you need to submit a single folder per team and that you must include both team members' names and the roles you had in each of the python program files. It is also a good idea for the partner who is not submitting to upload the name of his or her partner.
Note that submitted files with incorrect filenames may not receive full credit because it makes grading more difficult for us and the TAs, so please check filenames carefully!